NHS A&E: National Trend and Trust Benchmarking
Healthcare (NHS)
What drives A&E 4-hour target breaches, and which trusts are the clearest outliers, best and worst?
NHS England publishes A&E performance data for every trust in the country every month. This project analyses a full year of that real, current data (April 2025 to March 2026) to answer the question a health service performance team would actually ask.
Findings
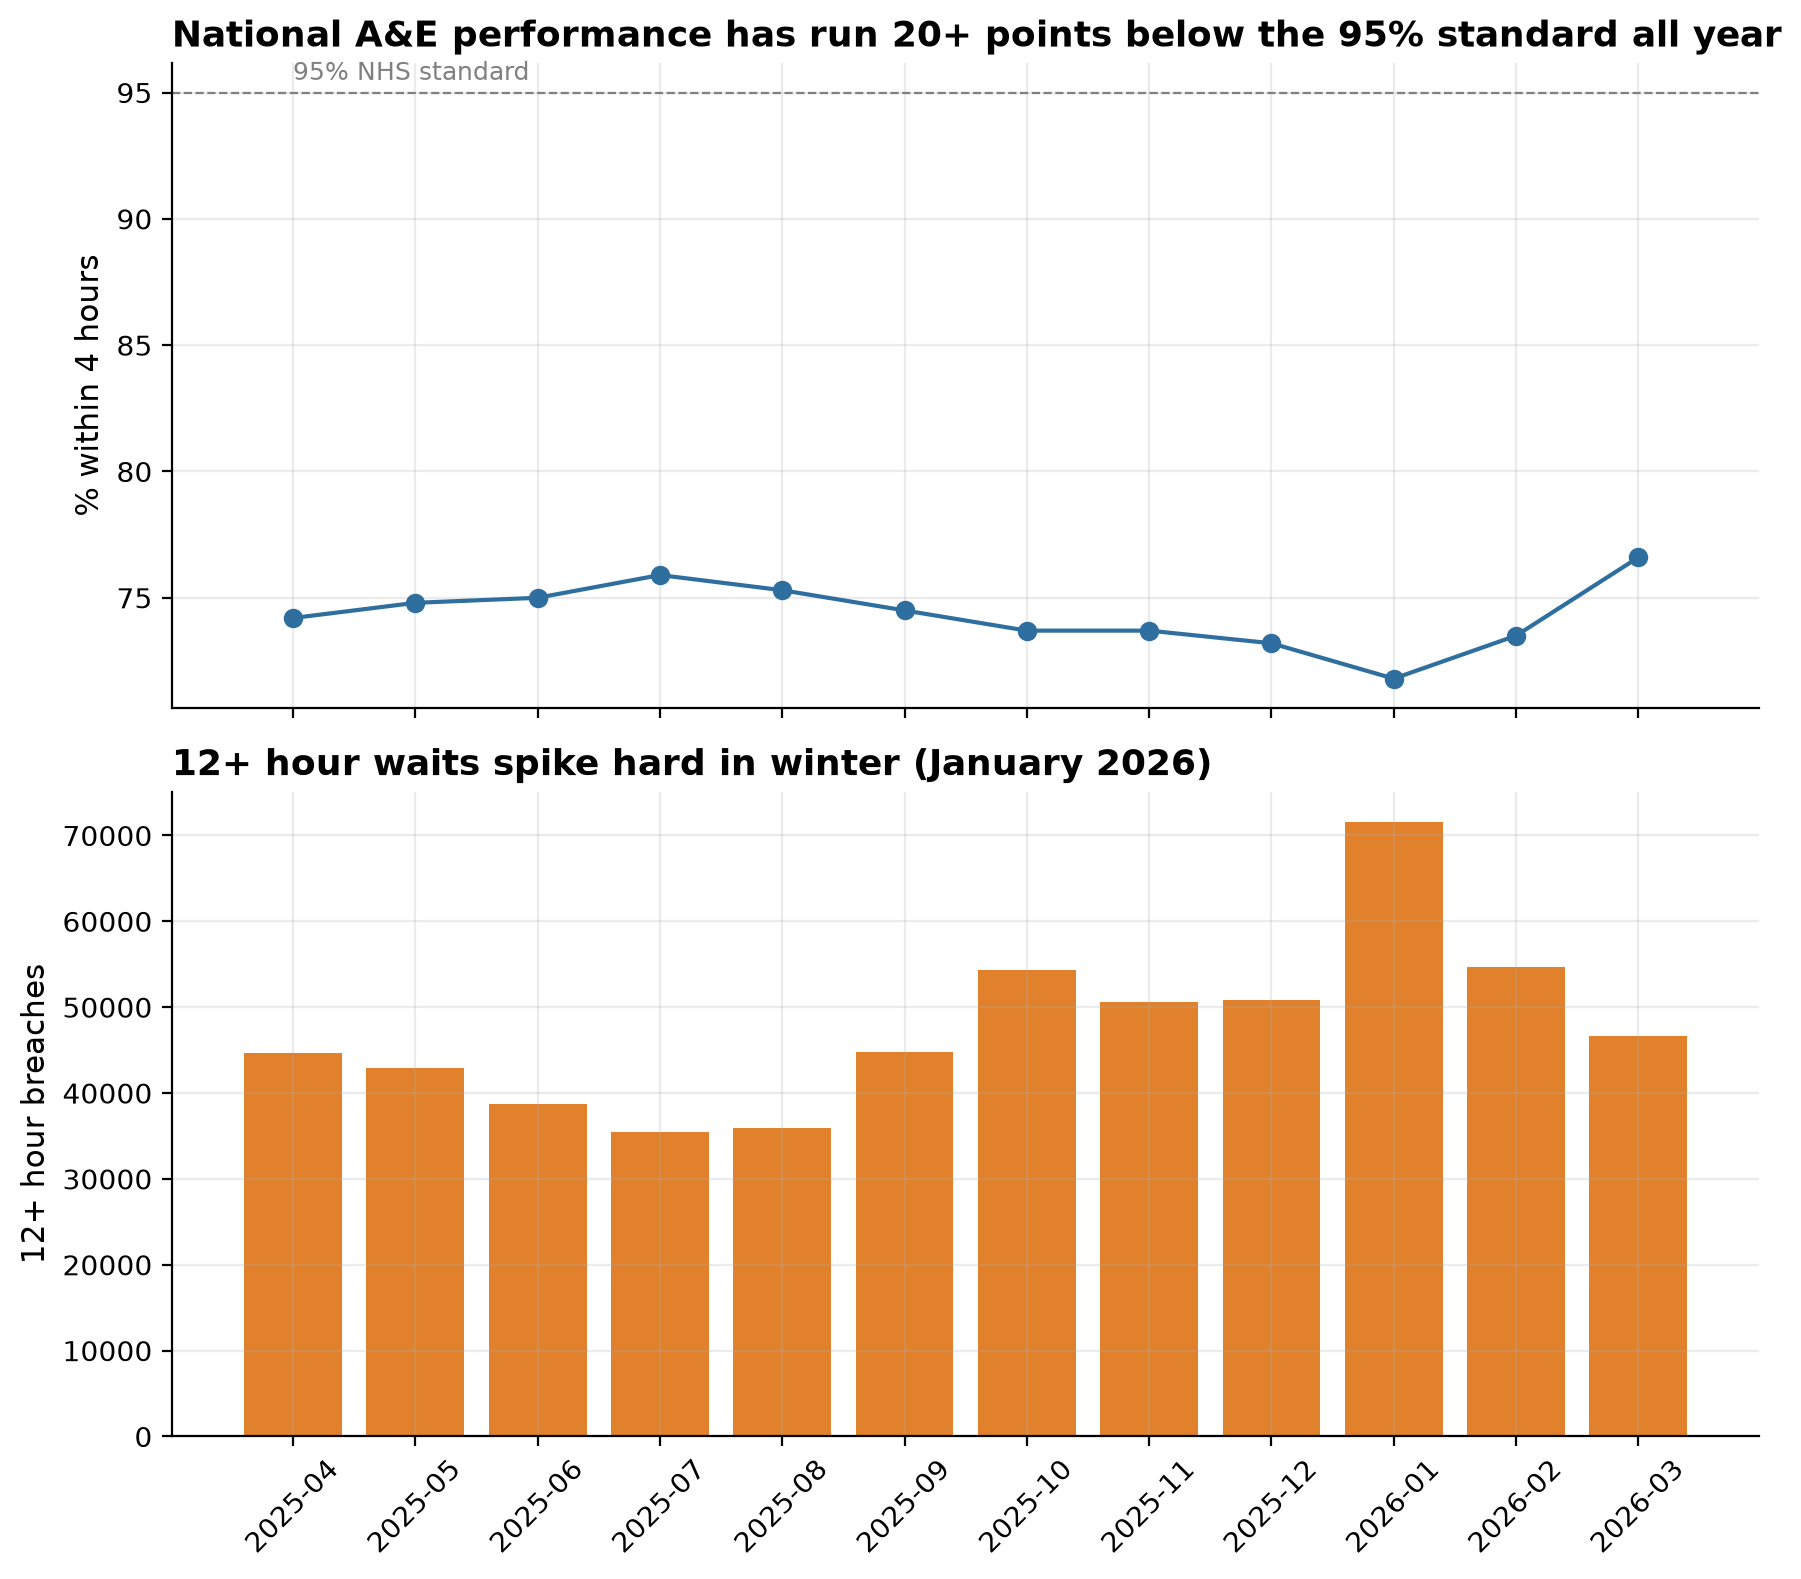
National performance has sat well below the NHS’s own standard all year, and moves with the season. 4-hour performance ranged from 71.8% to 76.6% across the 12 months, far short of the 95% standard every single month. January 2026 was the low point: 71.8% performance and 71,517 attendances waiting 12 or more hours.
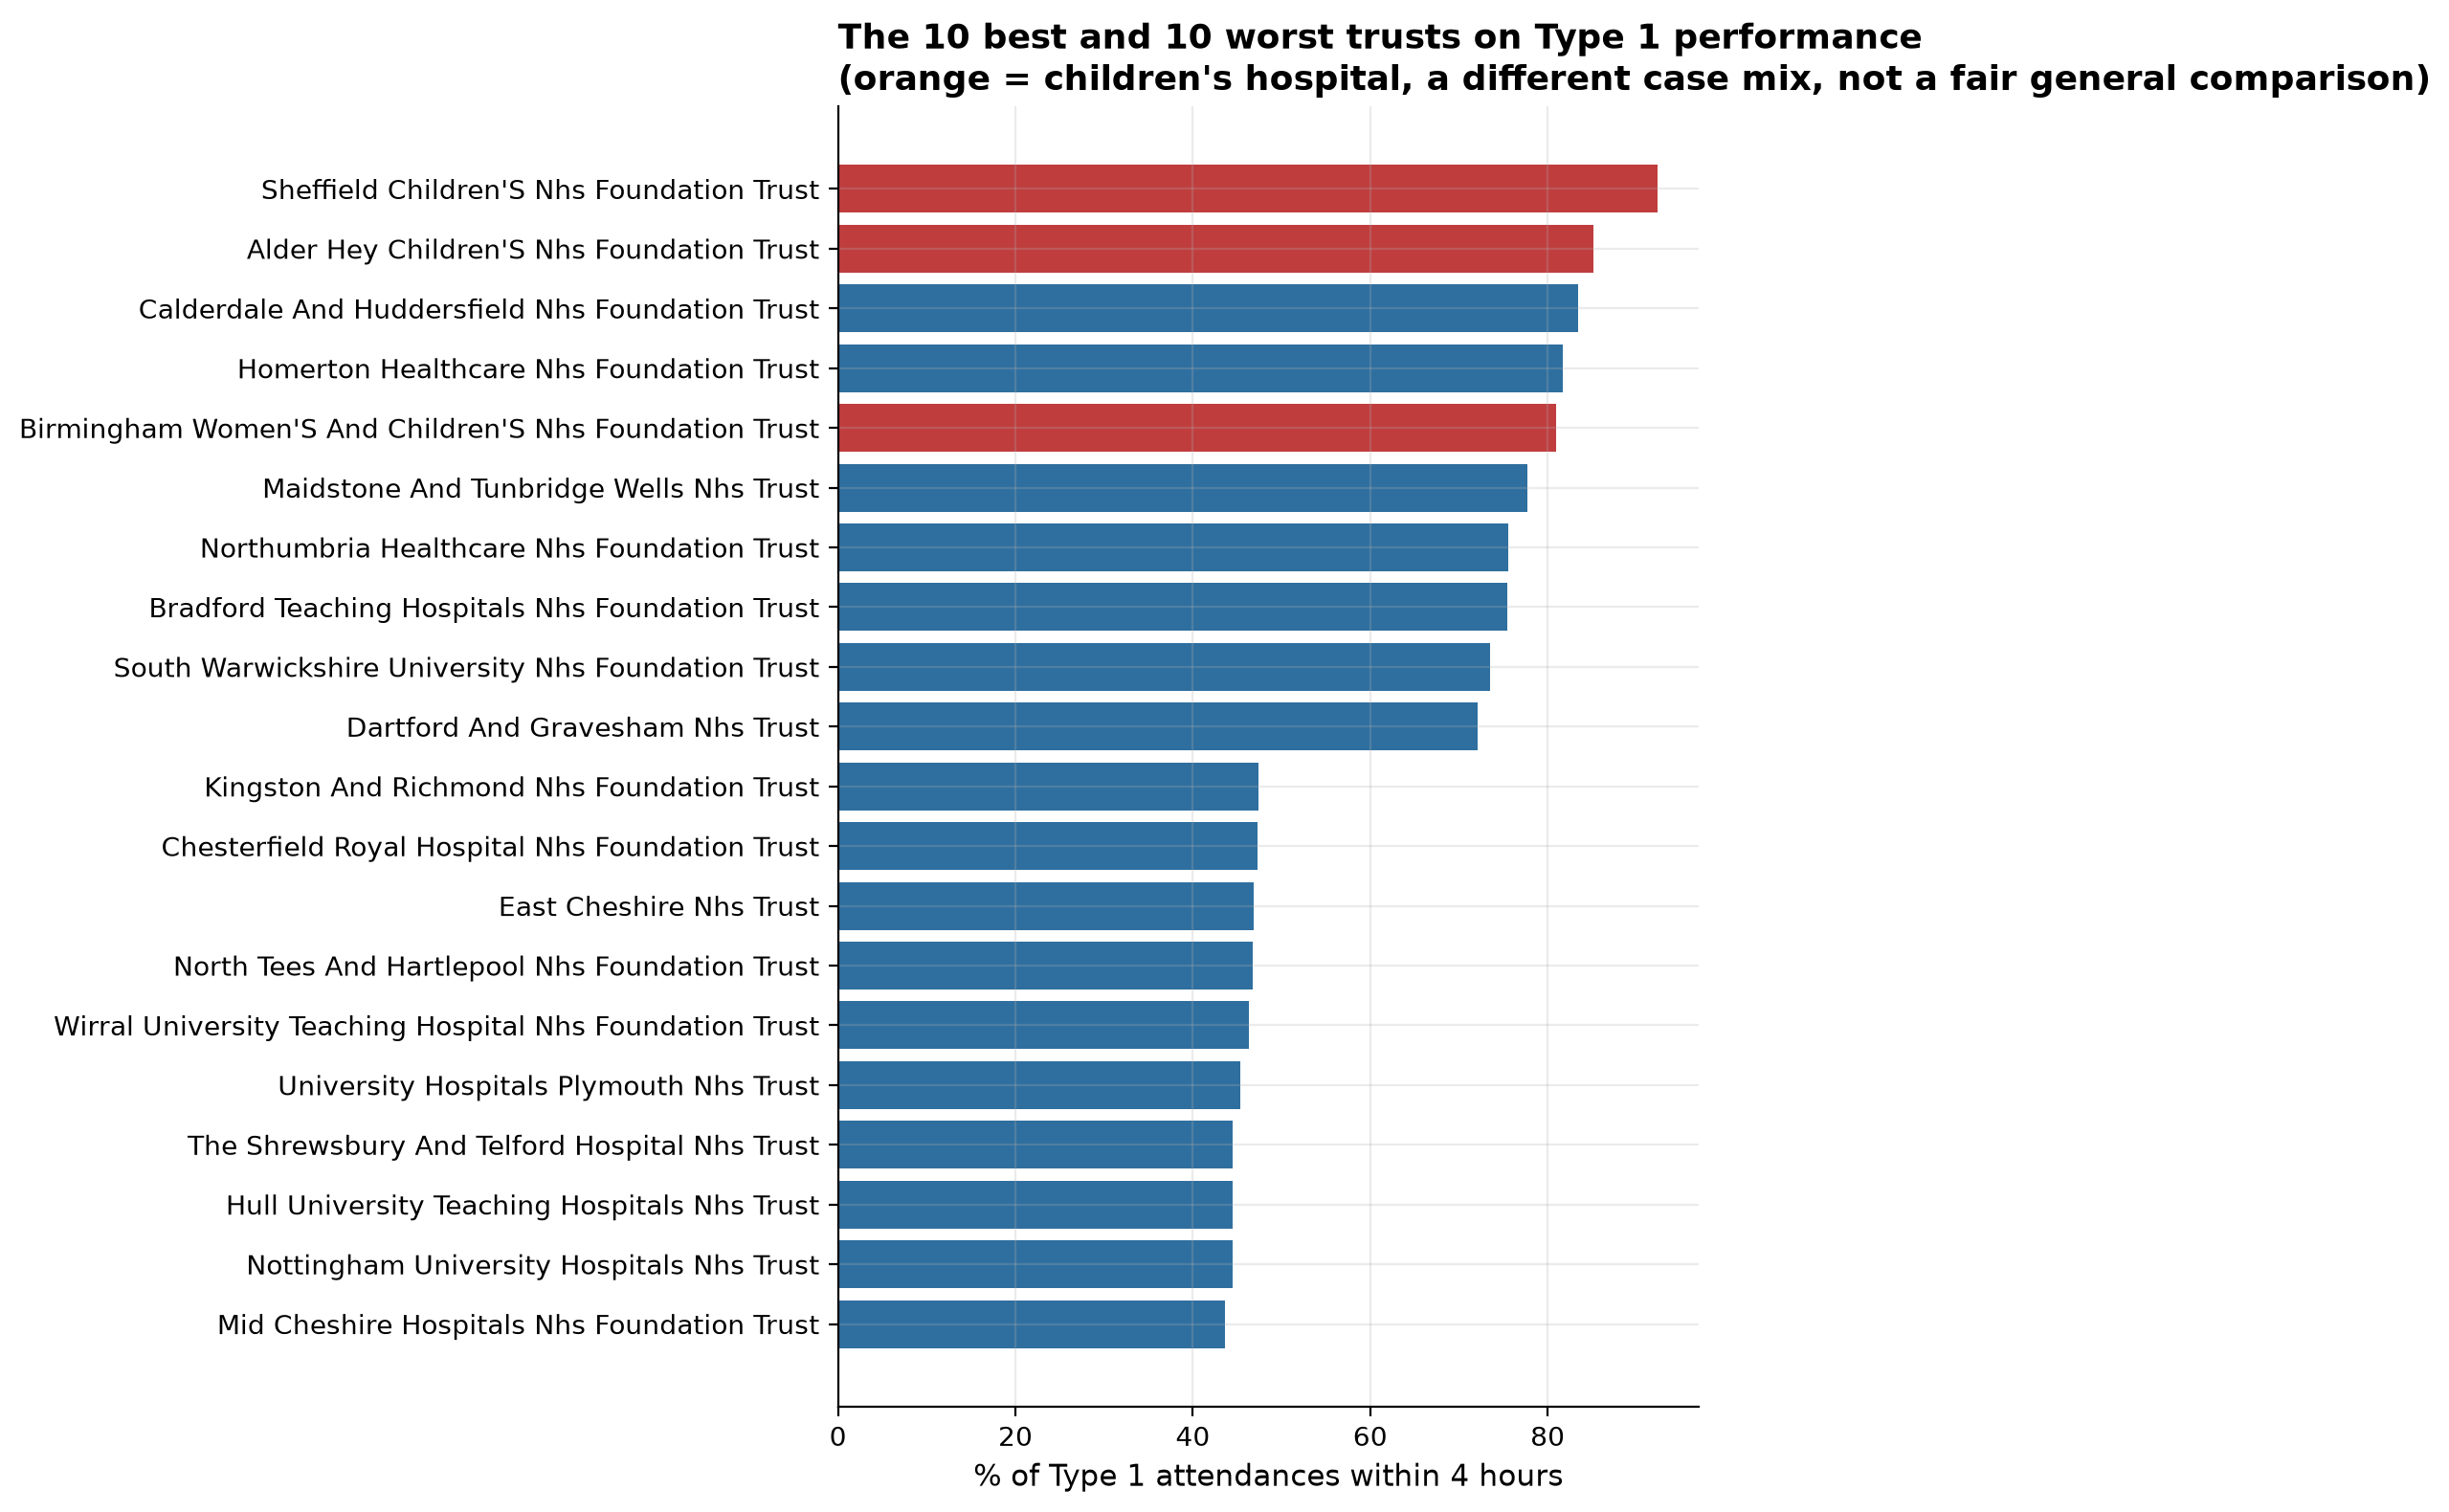
The best-performing trusts by Type 1 percentage are children’s hospitals, a case-mix confound, not a best-practice story. Excluding Sheffield Children’s (92.4%) and Alder Hey Children’s (85.2%), Calderdale and Huddersfield leads general trusts at 83.4%. The worst general trusts sit in the low-to-mid 50s percent.
The most severe measure, 12+ hour waits, varies about three times over by region, and trust size barely explains performance at all (a correlation of just 0.07 between average monthly Type 1 volume and 4-hour performance across 124 trusts).
Live dashboard
A note on tooling
This project was originally planned as a Power BI dashboard. Power BI Desktop has no native Mac build, and Power BI’s web service needs a work or school Microsoft account rather than a personal one, so it was built in Tableau instead. Full reasoning in the project README.
Full write-up
- Full report — methodology, limitations, and recommendations
- SQL and notebook on GitHub