Global Power Plants: the Renewable Transition
Energy
How far along is the world’s shift away from fossil fuel electricity generation, and how reliable is the data behind that question?
Governments, utilities, and investors need to know how fast the world is shifting away from fossil fuel electricity generation, and where. This project analyses the World Resources Institute’s Global Power Plant Database, about 28,700 power plants in 164 countries covering roughly 80% of the world’s generation capacity, to answer that directly from the data. It began as a past university assignment, redone here independently to a professional standard rather than resubmitted.
Findings
Renewables dominate by plant count, but not by capacity. By count, renewables already make up 62% of the world’s power plants. By capacity they’re only 25%, since fossil fuel plants are on average far bigger.
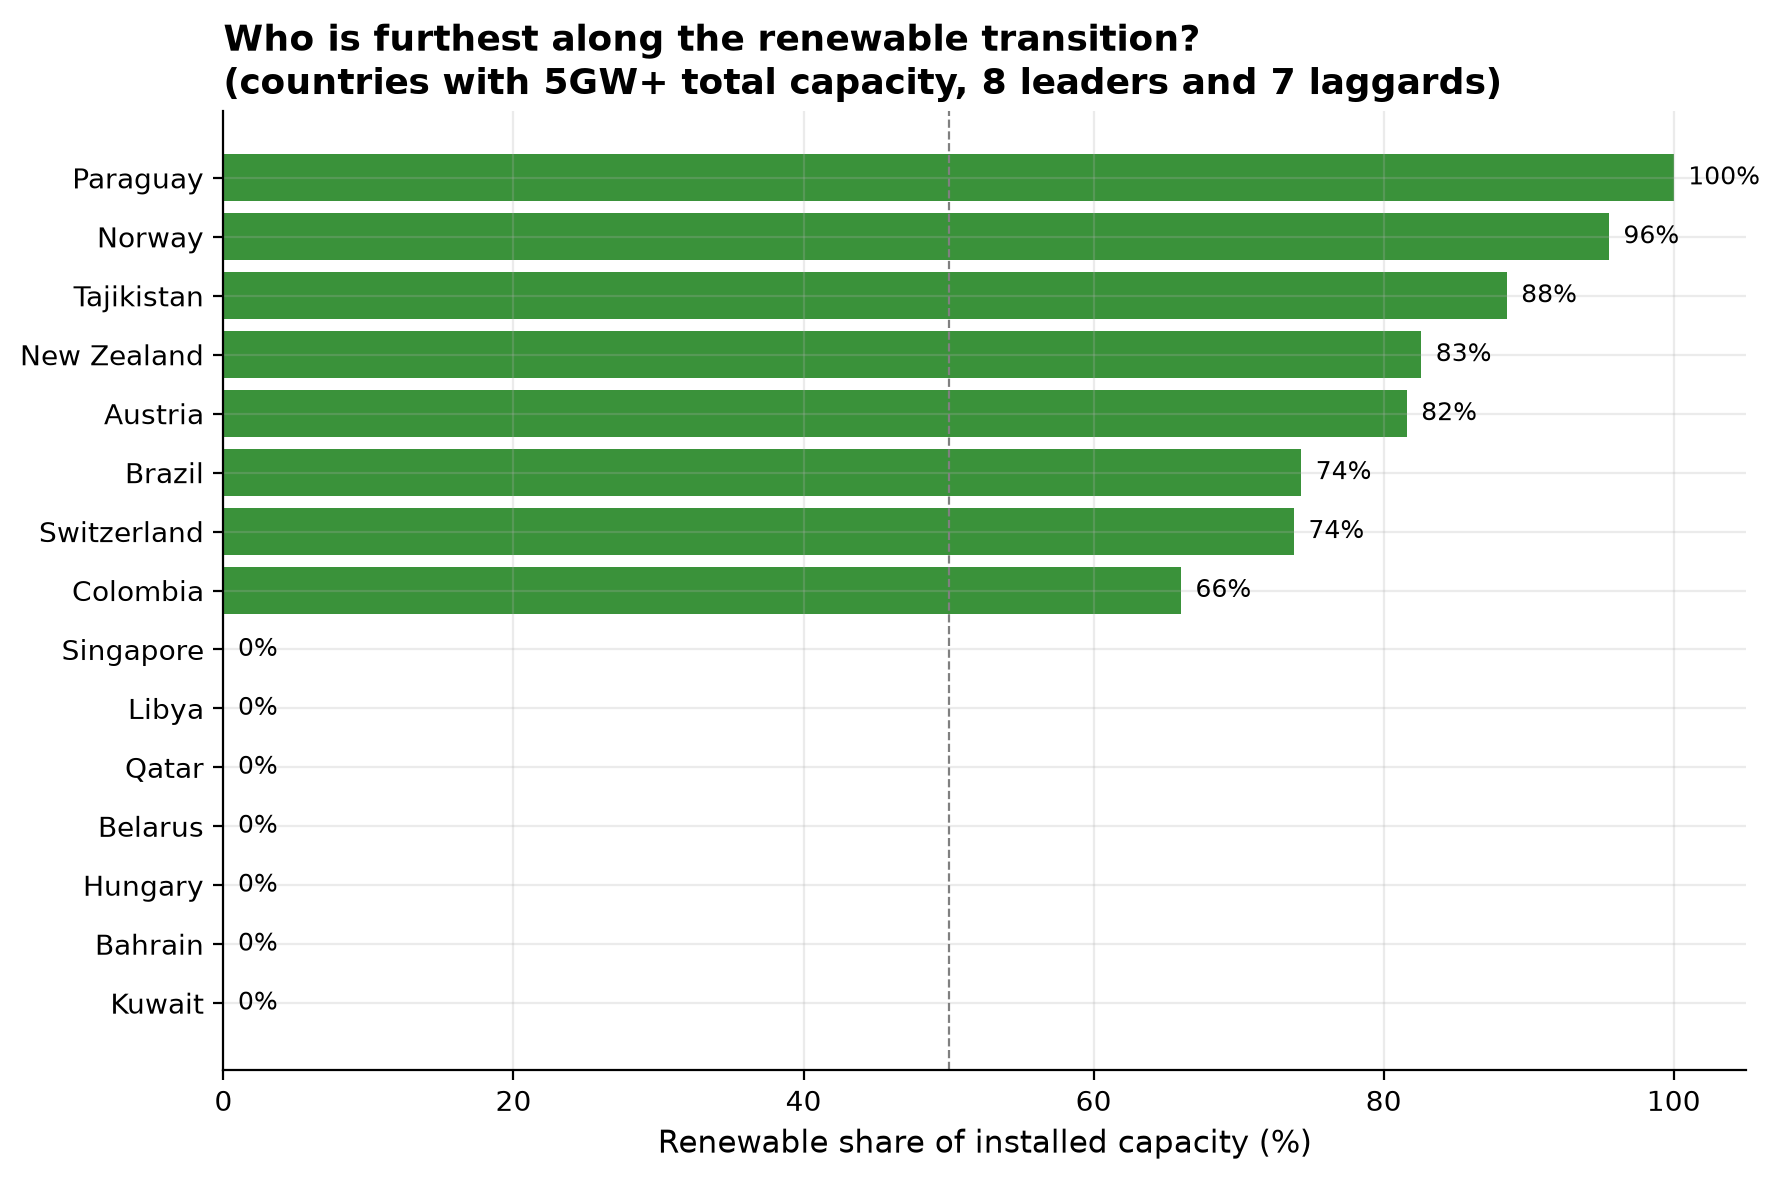
The renewable transition is deeply uneven across countries. The most renewable-heavy grids are hydro-rich countries (Paraguay 100%, Norway 96%, Tajikistan 88%). The least renewable are Gulf oil and gas states at or near 0%.
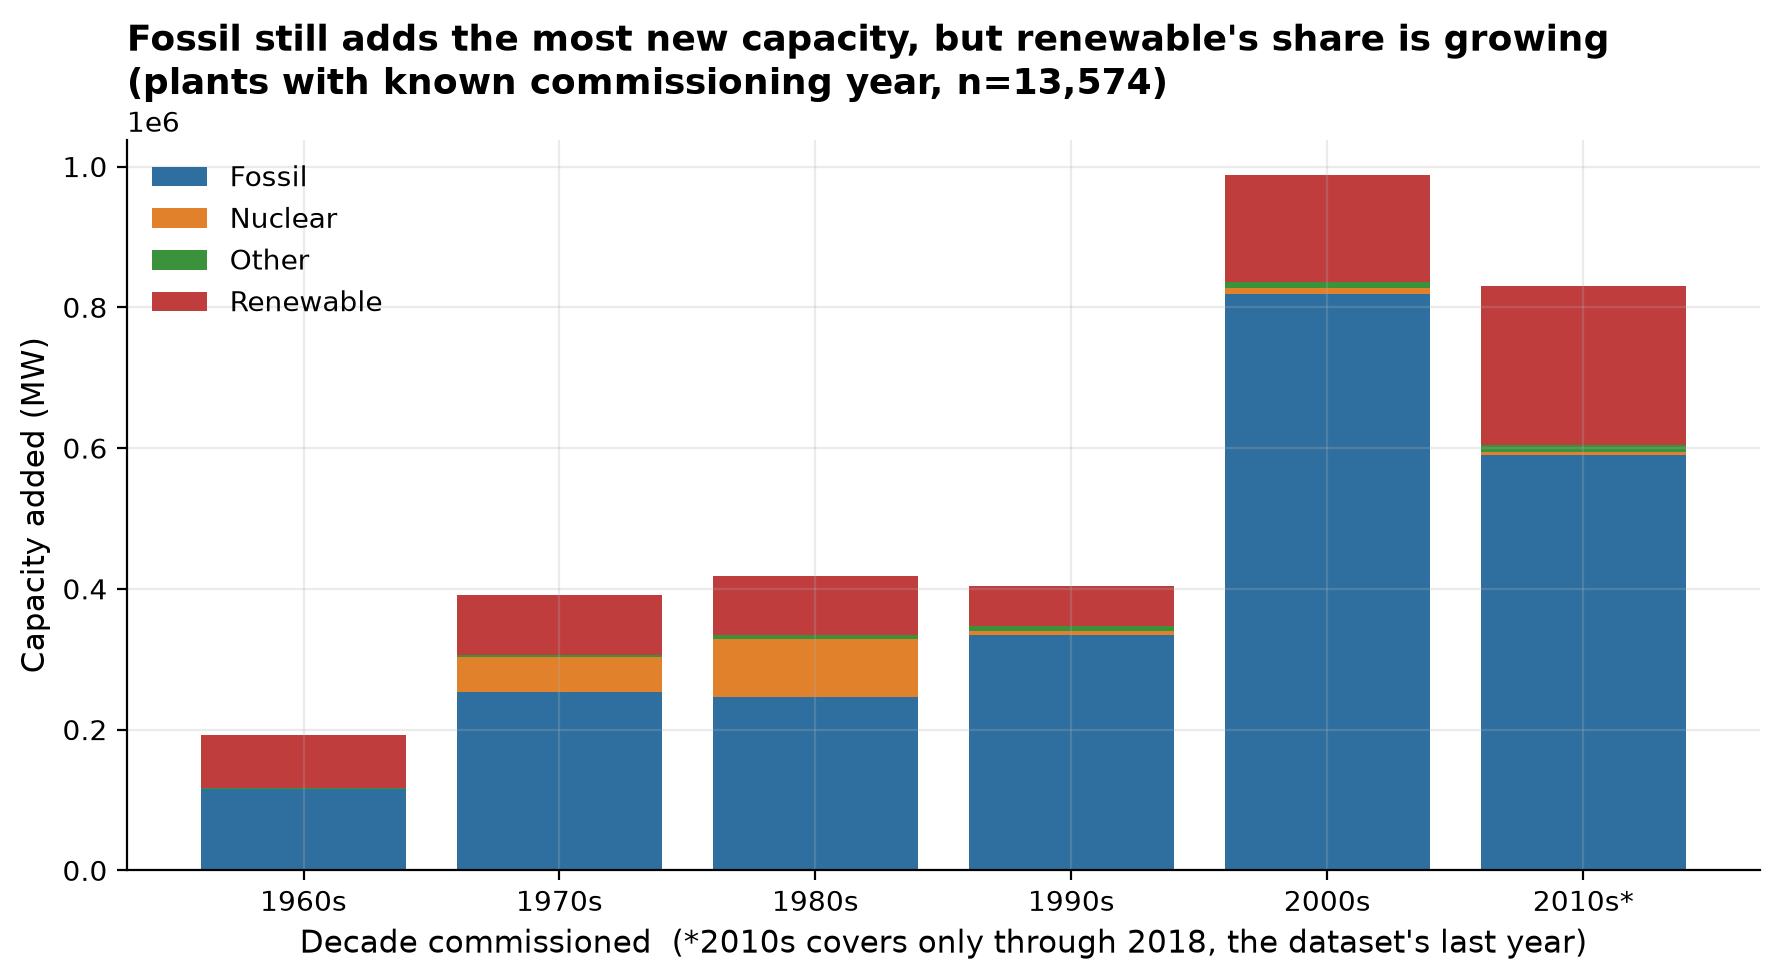
Fossil fuel still adds more new capacity than renewables every decade, but the gap is closing. Renewable’s share of new capacity rose from 15% in the 2000s to 28% in the 2010s (a partial decade in this data). Renewable plants are also the least documented: solar, biomass, and wind plants are missing a commissioning year for 60-64% of plants, versus 25-28% for coal and oil, which undercuts confidence in exactly how fast that transition is really moving.
Full write-up
- Full report — methodology, limitations, and references
- Notebook on GitHub
A live Tableau or Power BI dashboard for this project is still to come.